Unified Observability & IT Service Management Platform

Reduce downtime with real‑time alerting, dashboards, and machine‑learning‑powered analyticsfor logs, metrics, and traces—all on one platform. Try Motadata.

What We Offer

A single platform that unifies AIOps/Observability and IT Service Management (ITSM) so operations and service teams see the same truth, act faster, and close the loop—from detection to resolution.

Logs. Metrics. Traces.

Telemetry, End-to-End

Unified telemetry ingestion and analysis across infrastructure, networks, and applications.

Logs

Centralized log ingestion (agent-based or agentless) with live tailing, pattern clustering, and contextual views that surface surrounding events instantly.

Metrics

Continuous monitoring of infrastructure, OS, and network KPIs with Top-N views, trend analysis, and capacity planning insights.

Traces

Application Performance Monitoring captures distributed traces to visualize request paths and pinpoint latency or errors across services.

Technical highlights:

  • Smart parsers, keyword search, and high-scale log exploration for rapid root-cause analysis
  • SNMP, sFlow, and NetFlow ingestion for network visibility and traffic analytics
  • Lightweight agent-based trace collection with service maps and span-level insights

AI-driven NetOps control

Network Observability & Automation

Fragmented monitoring tools and slow fault isolation across complex networks.

How it works

An AI-powered network management system monitors device health, interfaces, traffic flows, and configurations. Built-in runbooks automate standard responses and remediation workflows.

Why it matters

Faster detection and resolution, reduced operational effort, and consistent response at scale.

 Technical highlights:

  • Real-time dashboards for packet loss, errors, discards, and interface utilization
  • Runbook automation for configuration validation, rollbacks, and ticket updates
  • Multi-vendor device support with customizable NOC views

From detection to resolution​

ServiceOps (ITSM)

Manual, disconnected hand-offs between monitoring and service management teams.

How it works

An ITIL-aligned ServiceOps suite covering Service Desk, Incident, Problem, Change, Release, Knowledge, Service Catalog, CMDB, Asset, and Patch management—integrated with observability signals and a conversational virtual agent.

Why it matters

Faster triage, improved SLA adherence, and audit-ready workflows from detection through closure.

 Technical highlights:

  • Incident, Problem, and Change workflows linked to CMDB relationships for impact analysis
  • Unified asset and patch governance across IT and non-IT environments
  • Knowledge-driven self-service and conversational AI to deflect tickets and reduce load

What We Offer

Deployment Options
Run where you need it: On‑premises, private cloud, or public cloud—with the same dashboards, analytics, and controls.

Establish a Secure Future.

Typical Reference Architectures

Hybrid IT & SRE Command Center

  • AIOps for logs/metrics/traces + ServiceOps for incident/change.
  • Automations: Alert → enrich → correlate → open incident with CI impact → runbook.
  • Outcome: MTTR down, SLA adherence up.

Enterprise NOC Modernization

  • Network observability (SNMP/flows) with traffic analytics and config checks.
  • Automations: Threshold breach → config snapshot → guided remediation.
  • Outcome: Fewer outages, faster rollbacks.

MSP Multi‑Tenant Operations

  • Segregated tenants, shared runbooks, and templated dashboards.
  • Automations: Customer‑specific playbooks and SLA reporting.
  • Outcome: Higher engineer efficiency and scale.

Establish a Secure Future.

Why Motadata

Unified platform

Observability and ITSM with shared data, context, and workflows.

AI-driven insights

Correlation, anomaly detection, alert grouping, and guided root-cause analysis.

Broad coverage

Logs, metrics, traces, network flows, and assets in a single view.

Fast onboarding

Agent-based or agentless collection with 200+ native integrations.

Let’s Build the Future Together

Reduce downtime with Motadata.

Start a free trial or book a live demo to see real‑time alerting, dashboards, and ML analytics across logs, metrics, and traces in your own environment.

Unified IT Operations for the Modern Enterprise

Motadata delivers AI-driven IT monitoring and management with seamless support from UClik Technologies.

Comprehensive Solutions for Modern IT Teams

Optimize Operations, Enhance Security, and Increase Efficiency

Motadata offers a unified platform with monitoring, analytics, and automation tools to improve IT performance. UClik Technologies ensures smooth integration and reliable support.

AIOps Platform

AI-driven insights for proactive IT operations and faster issue resolution.

Network Monitoring

Real-time visibility into network performance across all systems.

Infrastructure Monitoring

Monitor both on-premises and cloud IT environments efficiently.

Log Analytics

Analyze machine data to uncover trends and potential issues.

Network Automation

Automate recurring network tasks to increase operational efficiency.
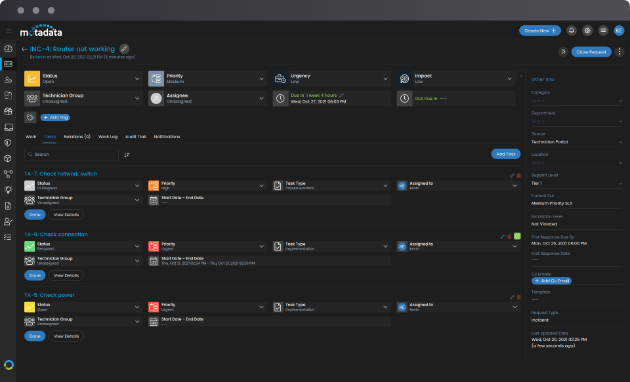
Service Desk

Streamline IT service delivery with AI-powered automation tools.

Asset Manager

Track IT and non-IT asset inventory across all locations.

Patch Manager

Automate patch management to maintain endpoint security consistently.

Collaborate for Operational Excellenc

Partnering with UClik Technologies helps Motadata expand offerings, reach new markets, and drive innovation by integrating advanced IT solutions and leveraging UClik’s network.

Let’s Build the Future Together

Empower Your Business with Motadata Solutions

Motadata products help your organization stay secure, connected, and efficient. Partner with UClik Technologies for expert guidance, seamless integration, and reliable support.

Establish a Secure Future.

Typical Reference Architectures

Enterprise Core / Government Data Center (Tier II–III)

  • Power: N+1 modular UPS → floor PDU → rPDUs (monitored/switched).
  • Cooling: Perimeter CRAH with containment; in‑row units for high‑density aisles.
  • Controls: Coordinated cooling (iCOM), DCIM integration, battery monitoring.

High‑Density / AI Pod

  • Power: Scalable UPS with lithium‑ion batteries; busway distribution and outlet‑level metering.
  • Cooling: Rear‑door heat exchangers or liquid loops with CDU; tight ΔT management.
  • Monitoring: Real‑time rack‑level kW and thermal maps for workload placement.

Edge / Smart City Command Center

  • Power & Cooling: SmartRow/SmartCabinet with integrated UPS, precision cooling, and fire systems.
  • Management: OOB access, environmental sensors, and centralized alerts.